Quick and Easy Visualisation of Indices through Aurora by Pixxel
.png)
Aurora by Pixxel, is an Earth observation studio set to simplify interactions with Earth observation data by introducing the ability to apply and download layers using established and new indices in a no-code environment.
After completing an extensive beta program with a targeted user cohort, we’re thrilled to announce the commercial launch of Aurora by Pixxel in Q3 of 2024. Aurora offers an intuitive, all-in-one solution with a comprehensive developer’s toolkit to address the common challenges associated with traditional GIS platforms.
The primary objective of Aurora is to streamline the access to and analysis of Earth observation data. Aurora by Pixxel achieves this through its integrated model marketplace and capability to create image-processing workflows in a no-code environment.
Understanding and visualising satellite imagery with Aurora
Remote sensing satellites capture multiple layers in a single image, representing distinct spectral bands or wavelengths. These layers correspond to specific bands or wavelengths of electromagnetic radiation, such as visible light or near-infrared (NIR), collectively offering a comprehensive view of the observed scene. By analysing these layers, researchers can obtain valuable insights into material composition, vegetation health, pollution levels, and more.
Pixxel - Aurora facilitates the exploration of these layers across different spectral bands, indices, and composite bands. This intuitive setup simplifies data visualisation, offering users quick insights and preliminary assessment of their Areas of Interest (AOIs).

As we continue delving into Aurora’s distinctive capabilities, one focal point is the array of indices readily available on the platform upon launch. Each of these offers distinct insights across various applications spanning multiple industry sectors.
Specifically, we cover the indices available by default in Aurora by Pixxel applicable to multispectral images from Sentinel-2. Additionally, forthcoming months will see the introduction of more ready-to-use indices for Pixxel’s hyperspectral images (namely, the anticipated Firefly constellation) and other sensors, such as Landsat 5, Landsat 8, Hyperion, Prisma, EnMap, Aster, and more.
Vegetation health and assessment
Vegetation health assessment is critical for understanding ecosystem dynamics, monitoring agricultural productivity, and assessing environmental changes. When applied over satellite imagery, vegetation indices provide valuable insights into vegetation health across diverse landscapes.
Among the diverse indices assessing vegetation health, the Normalised Difference Vegetation Index (NDVI) is a foundational metric. NDVI compares the near-infrared (NIR) and red light reflectance, providing insights into terrestrial vegetation’s overall vitality and greenness. However, NDVI has its limitations, including saturation in certain phenological phases, susceptibility to soil effects, and vulnerability to atmospheric interference.
.png)
Supplementary indices, like the Enhanced Vegetation Index 2-2 (EVI2-2) exist to address these limitations and offer a more comprehensive assessment of vegetation health. EVI2-2 incorporates additional spectral indices to offer a robust framework for comprehending vegetation cover across diverse landscapes.
In addition to these indices, specialised metrics like the Visible Atmospherically Resistant Index (VARI) provide a straightforward approach to quantifying vegetation density and health using only the visible range of the spectrum. Other indices such as Rededge 2, Green Chlorophyll Index (GCI), Red Edge Chlorophyll Index (RECI), Chlorophyll Vegetation Index (CVI), Plant Senescence Reflectance Index (PSRI), Normalised Difference Red Edge (NDRE), Structure Intensive Pigment Index (SIPI), Triangular Vegetation Index (TVI), Modified Triangular Vegetation Index 2 (MTVI2), Soil Adjusted Vegetation Index (SAVI), Modified Soil Adjusted Vegetation Index (MSAVI), and Green Normalised Difference Vegetation Index (GNDVI) also feature on Aurora’s readily deployed indices, catering to specific applications and environmental conditions.

Water detection and monitoring
Water monitoring is critical for monitoring hydrological cycles and detecting changes in environmental factors, the impact of natural calamities, contamination levels, and other quality indicators. Indices like the Normalised Difference Water Index (NDWI) and Normalised Difference Drought Index (NDDI) offer valuable insights into water distribution and drought severity, respectively.
.png)
The Normalised Difference Moisture Index (MDMI) and Moisture Stress Index (MSI) complement these vegetation indices by detecting and measuring moisture levels in vegetation. Additionally, the Oil Spill Index (OSI) facilitates the identification and evaluation of oil spills or hydrocarbon pollution in aquatic environments.


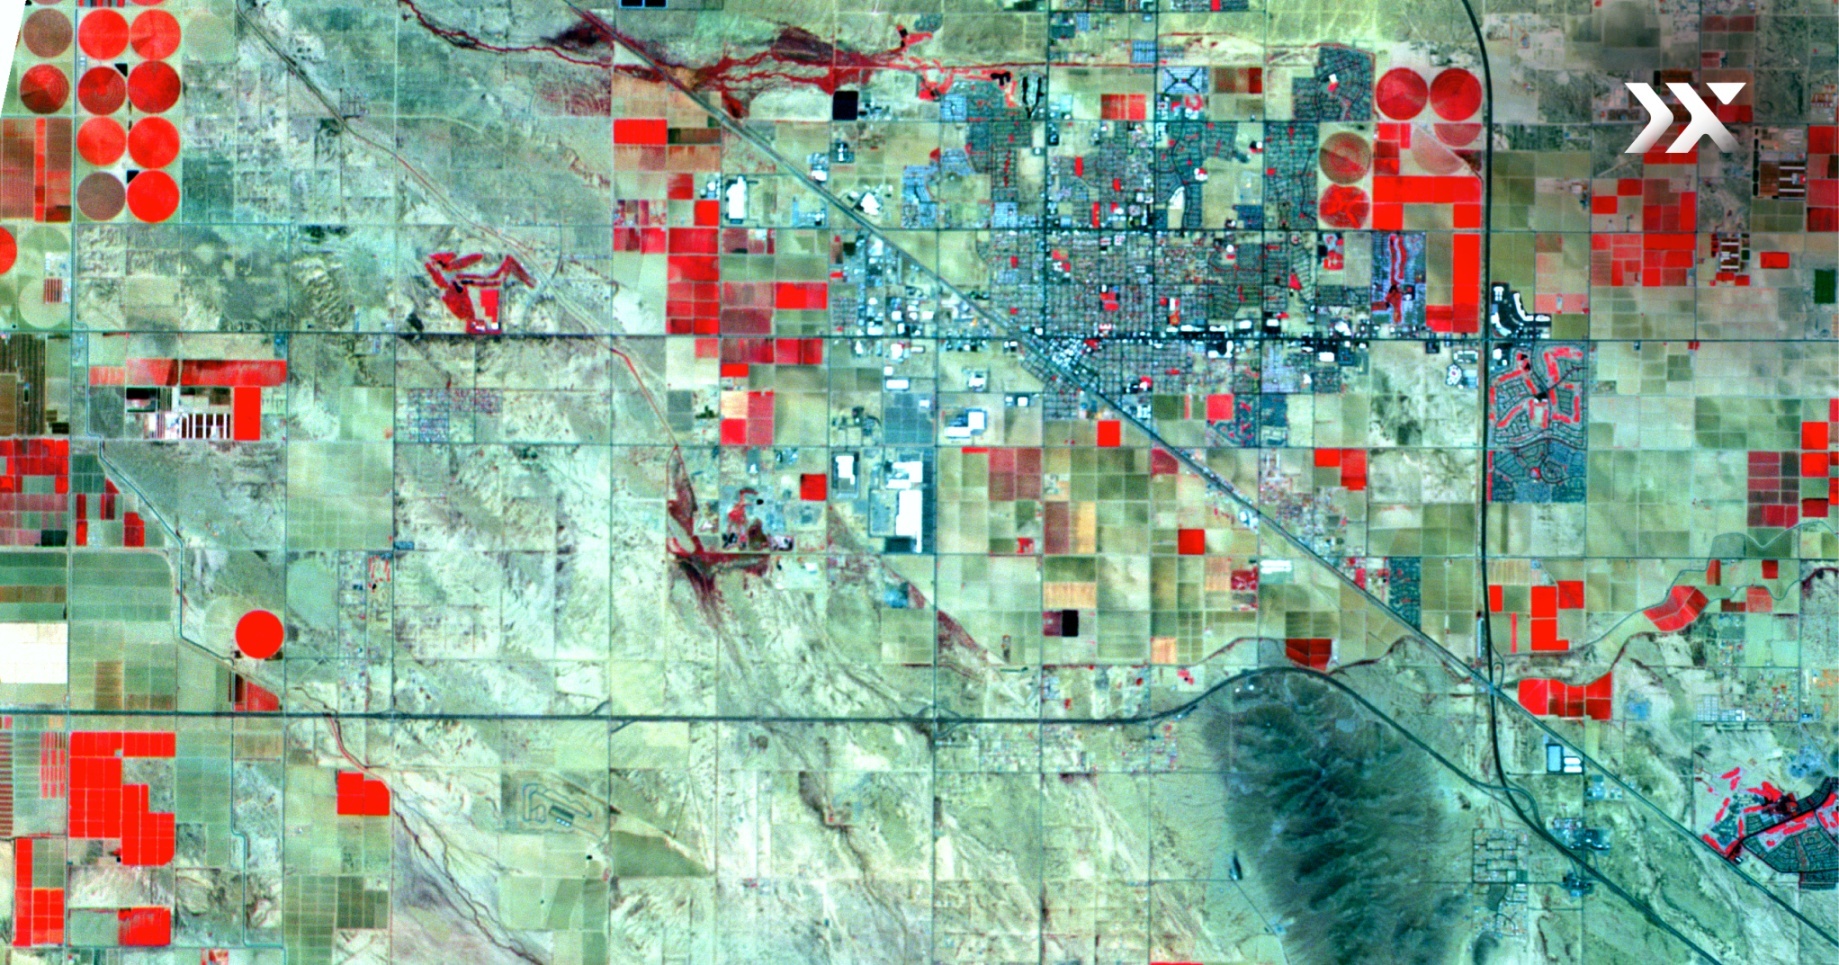
Urban area assessment
Assessing urban areas is essential for understanding urban growth patterns, land use changes, and the impact of urbanisation on the environment. The Normalised Difference Built-up Index (NDBI) provides a comprehensive method for assessing the extent and density of urban areas, leveraging data from the near-infrared (NIR) and shortwave infrared (SWIR) bands of the spectrum.
.png)

Snow detection
Snow detection is crucial for monitoring snow cover extent, snowmelt, and its impact on water resources and ecosystems. The Normalised Difference Snow Index (NDSI) is a valuable tool for accurately detecting snow cover within a pixel, offering insights into snow mapping and monitoring applications across various regions and seasons.
.png)

Fire damage assessment
Assessing fire damage is essential for understanding wildfire severity, burned area mapping, and post-fire recovery monitoring. The Normalised Burn Ratio Index (NBRI) provides valuable insights into the extent and severity of fire damage by analysing the reflection of near-infrared (NIR) against the absorption of shortwave infrared (SWIR).
.png)

Find the full list of available indices on Aurora by Pixxel with their respective formulae, unique features, and applications through our downloadable document.
Custom index creation
Besides the extensive list of readily deployable indices, Aurora by Pixxel also provides more experienced users with custom index creation capabilities. With Aurora, users have the freedom to design and save their own index formulae, tailored to their specific research needs or environmental conditions.

Aurora offers a range of options for creating custom indices including normalised difference indices, band difference calculations, band ratios, and formulae using available spectral bands. This level of customisation empowers users to extract precise insights from satellite imagery, allowing for a deeper understanding of Earth's dynamics.
Aurora by Pixxel promises to revolutionise the acquisition and analysis of Earth observation data through its comprehensive suite of pre-defined models and indices tailored to diverse industry needs. With its intuitive interface and powerful capabilities, Aurora extracts valuable insights from satellite imagery effortlessly.
Learn more about Pixxel - Aurora by signing up and stay tuned for the commercial launch.