A Comprehensive Guide to Pixxel - Aurora's Marketplace Models

Aurora by Pixxel, our Earth observation studio, is set to simplify interactions with Earth observation data by offering drag-and-drop model-building capabilities.
With the commercial launch of Aurora in Q2 2024, Pixxel aims to address the challenges commonly encountered with traditional GIS software by granting early access to a limited set of customers in February 2024. This platform goes beyond the conventional functions of an image processing tool, positioning itself as an intuitive one-stop solution equipped with a comprehensive developer’s toolkit.
The primary goal of Aurora by Pixxel is to simplify earth observation analyses with a built-in marketplace and the unique ability for users to create and customise their workflows in a no-code environment. As an end-to-end toolkit, Aurora empowers users to extract tailored insights from various Earth observation datasets.
As we continue exploring Pixxel - Aurora’s unique capabilities, we unravel the diverse models that’ll be readily available on the studio upon launch and those which are in the pipeline, together with planned hyperspectral analysis tools. Each of these models offers unique insights across diverse use cases ranging across several industry verticals.
.png)
Land use/Land cover (LULC)

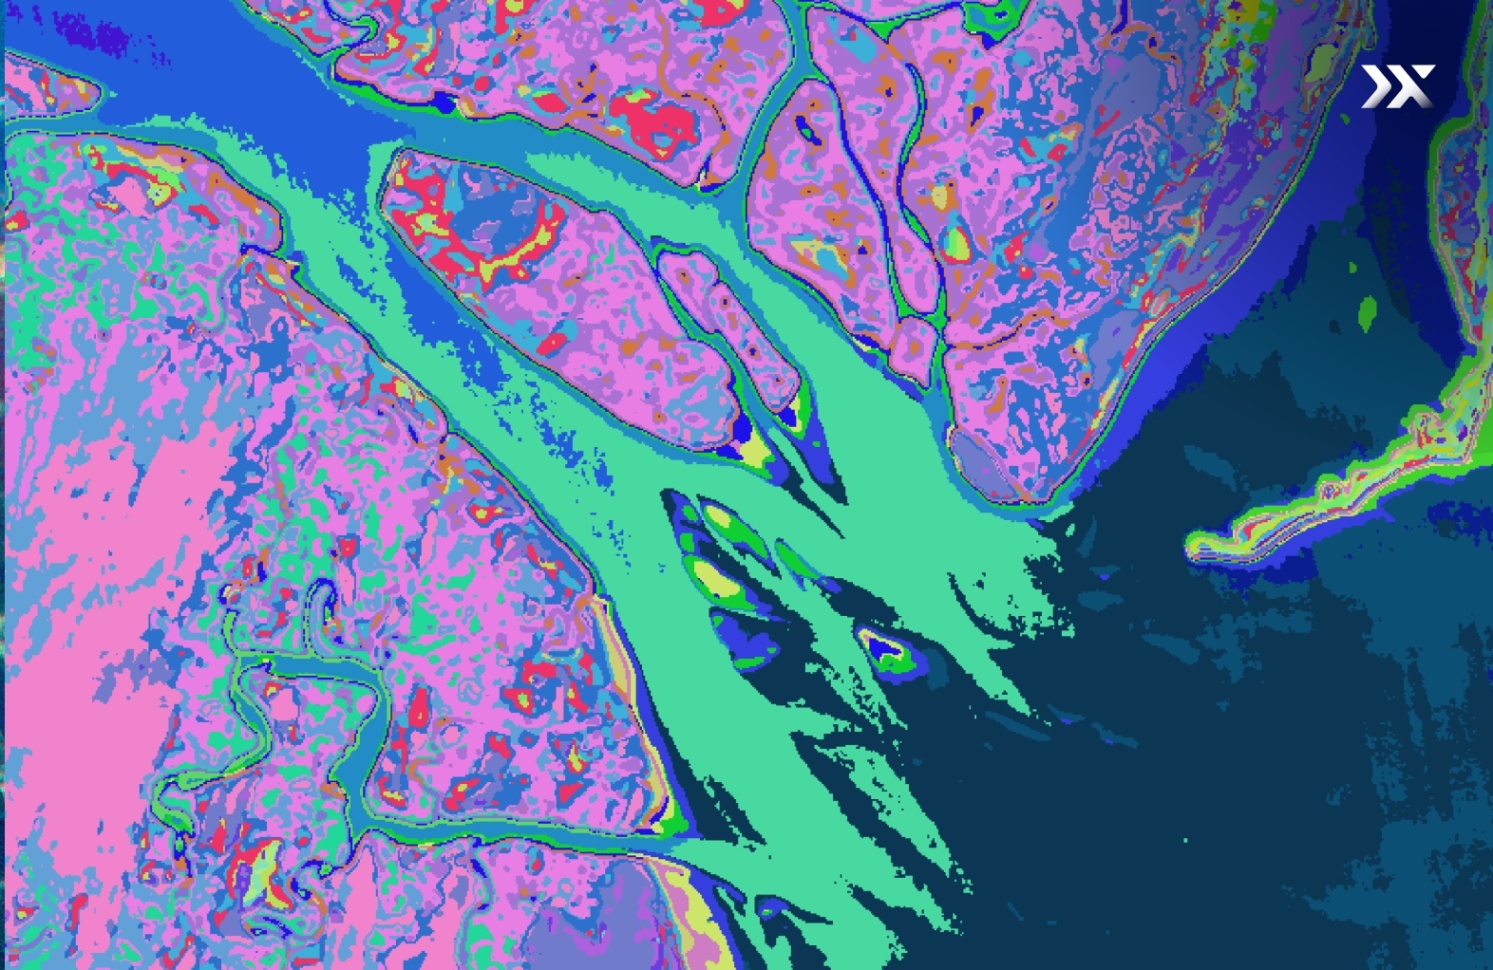
Land Use/Land Cover (LULC) classification involves categorising land based on the prevalent human activities or natural characteristics present. These can range from vegetation and water bodies to croplands, forests, and urban areas. LULC data serves as a valuable tool (particularly in the context of governments) for understanding land use patterns, evaluating the environmental impact of land use changes, and informing decisions related to land use planning.
The deep learning model integrated in Aurora by Pixxel specifically focuses on LULC classification using Sentinel-2 satellite imagery, creating output tiles annotated with class labels. Trained on a robust dataset of labelled imagery, the model employs convolutional neural networks (CNNs) to automatically extract relevant features from the input imagery. It subsequently classifies each pixel into predefined LULC classes, similar to ESRI’s 9-class LULC classifications. The model exhibits an accuracy ranging from 75 - 90%, dependent on geographical variations.
Crop Stress

The Crop Stress model was meticulously designed to detect and quantify crop stress within a designated Area of Interest (AOI). Employing a robust statistical methodology, this model classifies features within the AOI into distinct stress levels, namely “low, moderate, or high.” Through precise calculations, this readily deployable model unveils the proportions of land covered by each stress category, providing agricultural organisations and stakeholders with insights into the varying levels of stress affecting their crops.

Cloud Gap Fill

The Cloud Gap Fill model is a powerful solution to one of the most common issues faced by satellite remote sensing techniques: cloud cover. The model leverages inputs from diverse images captured on different dates, showcasing intelligent pixel filling and seamlessly reconstructing the underlying area with predicted characteristics. This capability ensures a comprehensive analysis of the AOI on specific dates of interest, free from the challenges posed by cloud cover.
The Cloud Gap Fill model was trained to eliminate various cloud cover types, ensuring a comprehensive cleanup process. These include:
- Cloud shadow
- Cloud medium probability
- Cloud high probability
- Thin cirrus (haze)
Segmentation models

The Segmentation model is a versatile tool for segmenting visible objects in satellite imagery from various platforms. It provides a nuanced understanding of landscapes through object detection, prioritising accuracy and efficiency. Its optimal performance relies on clearly visible and sufficiently sized objects.
While the model operates as a single, independent module, users can select between different modes to suit their requirements. It allows users to select between general segmentation, distinguishing between roads, buildings, vegetation, etc. or specific segmentation, such as crop boundary classification. The general segmentation ensures versatility, while the specific segmentation caters to niche applications. Users should consider trade-offs between speed and accuracy when choosing which of these variants should be applied to their imagery. Adjusting zoom levels can further enhance segmentation quality, ensuring optimal results across various scenarios.
For specialised tasks, like farm boundary detection, the segmentation model offers precision in delineating physical boundaries crucial for optimising resource allocation and maintaining accurate land records in modern agriculture.
Optical Fusion
.gif)
The Optical Fusion model addresses the inherent limitations faced by varying spatial and temporal resolutions of different satellites, unlocking the potential for enhanced collaboration across data sources. For instance, the model promotes synergy across images from Sentinel (revisit frequency: 5 days, resolution: 10-metres) and MODIS (revisit frequency: 1 day, resolution: 500-metres).
Optical Fusion transcends the individual constraints of satellite sensors by amalgamating data with distinct spectral ranges, spatial resolution, and slew angles. This strategic fusion enhances the accuracy of optical remote sensing data, mitigating challenges such as atmospheric interference or cloud cover. The result is a composite image with a revisit frequency of 1 day and a spatial resolution of 10 metres, harnessing the strengths of both sources.
Utilising statistical techniques and a spatio-temporal fusion method, the Optical Fusion model generates high-resolution images by synthesising information from low-resolution imagery. The output images surpass the limitations of individual satellites and serve as valuable inputs for diverse applications, including crop growth monitoring.
Models in the pipeline
- Change Detection Model with Quantified Numbers: This model detects changes over Earth during two-time intervals using index layers or in-house models like LULC. Utilising remote sensing data, it categorises changes, enabling tracking of transformations in AOI, such as the conversion of vegetation areas into buildings.
- Crop Growth Monitoring: Tracking changes in crops over farmland, this model provides insights into the crop growth cycle, including duration, start, peak, and end of the season.
- Crop Biophysical and Biochemical Parameters: Offering multiple insights about vegetation in the AOI, this model provides data on Leaf Area Index, Chlorophyll content, and brown pigment, aiding in determining vegetation state and health for diverse analyses.
- Crop Type Classification: Identifying crop types in specific regions allows for the production of crop acreage maps. Analysis of factors like colour and growth patterns aids governments and agricultural agencies in monitoring and planning for food production.
- Crop Yield Estimation: This model provides estimates of the likely harvest, crucial for farmers, policymakers, and agricultural insurance companies for effective planning and decision-making.
- Crop Species Identification: This model distinguishes unknown and known crop species in large farm areas, crucial for ensuring the quality and purity of agricultural products.
- Water Quality Monitoring: Tracking water quality in reservoirs, lakes, ponds, and ocean waters, this model identifies contamination by suspended matter, phytoplankton, turbidity, or dissolved organic matter. Applications extend to sustainable water resource management.
- Algal Bloom Monitoring: Critical for safeguarding water quality and aquatic ecosystems, this model monitors water bodies for the presence and extent of harmful algal blooms, identifying regions with rapid algal growth.
- Forest Biomass Estimation: Estimating forest biomass is crucial for carbon flow examination within terrestrial ecosystems. This model provides insights into forest management, wildlife conservation, and climate change tracking.
- Mineral Exploration: Offering a non-destructive method for mineral exploration, this model detects potential mineral and rock sites on Earth's surface, aiding mining companies in locating and exploiting valuable deposits.
Planned Hyperspectral Analysis Tools
- Image Clustering: Categorising similar objects or areas in satellite images, this model aids in urban planning, zoning, and land use decisions for organised and efficient urban development.
- Principal Component Analysis (PCA): PCA highlights important features in satellite images, simplifying complex data aiding in identifying trends, and changes, and monitoring urban growth or environmental shifts.
- Spectral Unmixing: Involves a set of analytical techniques using information from individual pixel spectra to characterise their composition, enables subpixel analysis, allowing for the evaluation and identification of unique contributions to a pixel’s signal.
- Spectral Library Analysis: A set of reference spectra assembled from diverse settings such as laboratories, field surveys, or other remote sensing measurements, spectral libraries provide reference data for identifying and matching specific signatures within hyperspectral imagery.
Pixxel -Aurora will be a game-changer in Earth observation, offering a range of models to meet diverse industry requirements.
Stay tuned to find out more about Aurora's capabilities and how it can revolutionise your approach to Earth observation data. Join our waiting list to be one of the first to access Aurora by Pixxel and its growing selection of models, indices, and hyperspectral analysis tools.


