
1.1. What is Hyperspectral Imaging?
Every pixel in a hyperspectral image contains a detailed spectral signature, akin to a chemical fingerprint of the material below. But to truly understand what makes hyperspectral imaging so powerful, we need to look at how it captures data differently from conventional sensors.

Hyperspectral imaging (HSI) is an advanced remote sensing technique allowing us to see theworld in greater detail than most conventional satellite sensors can perceive. Fundamentally,HSI captures image data across hundreds of narrow, contiguous spectral bands, spanningthe visible, near-infrared (VNIR), and shortwave infrared (SWIR) regions of theelectromagnetic spectrum—typically ranging from 400 to 2500 nanometers.
While most commercial space-borne HSI systems, including Pixxel’s, focus on the VNIR and SWIR regions, hyperspectral sensors can extend into the thermal infrared (TIR) range in specialised airborne or lab-based setups, enabling applications in heat detection, gas analysis, and thermal emissivity studies.
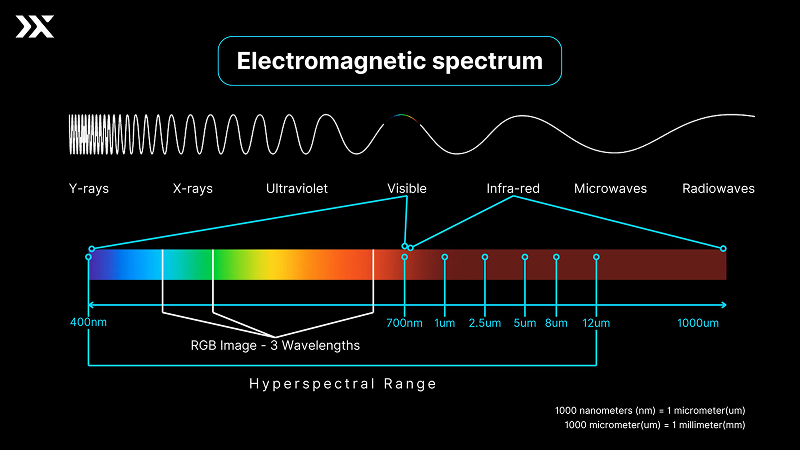
Unlike traditional imaging systems that capture red, green, and blue (RGB) or multispectral systems that capture 4 to 10 broader bands, hyperspectral sensors collect data in narrow spectral intervals—between 1 and 10 nanometers. This enables HSI to detect subtle differences in how materials reflect light, offering extraordinary insight into their chemical and physical properties.
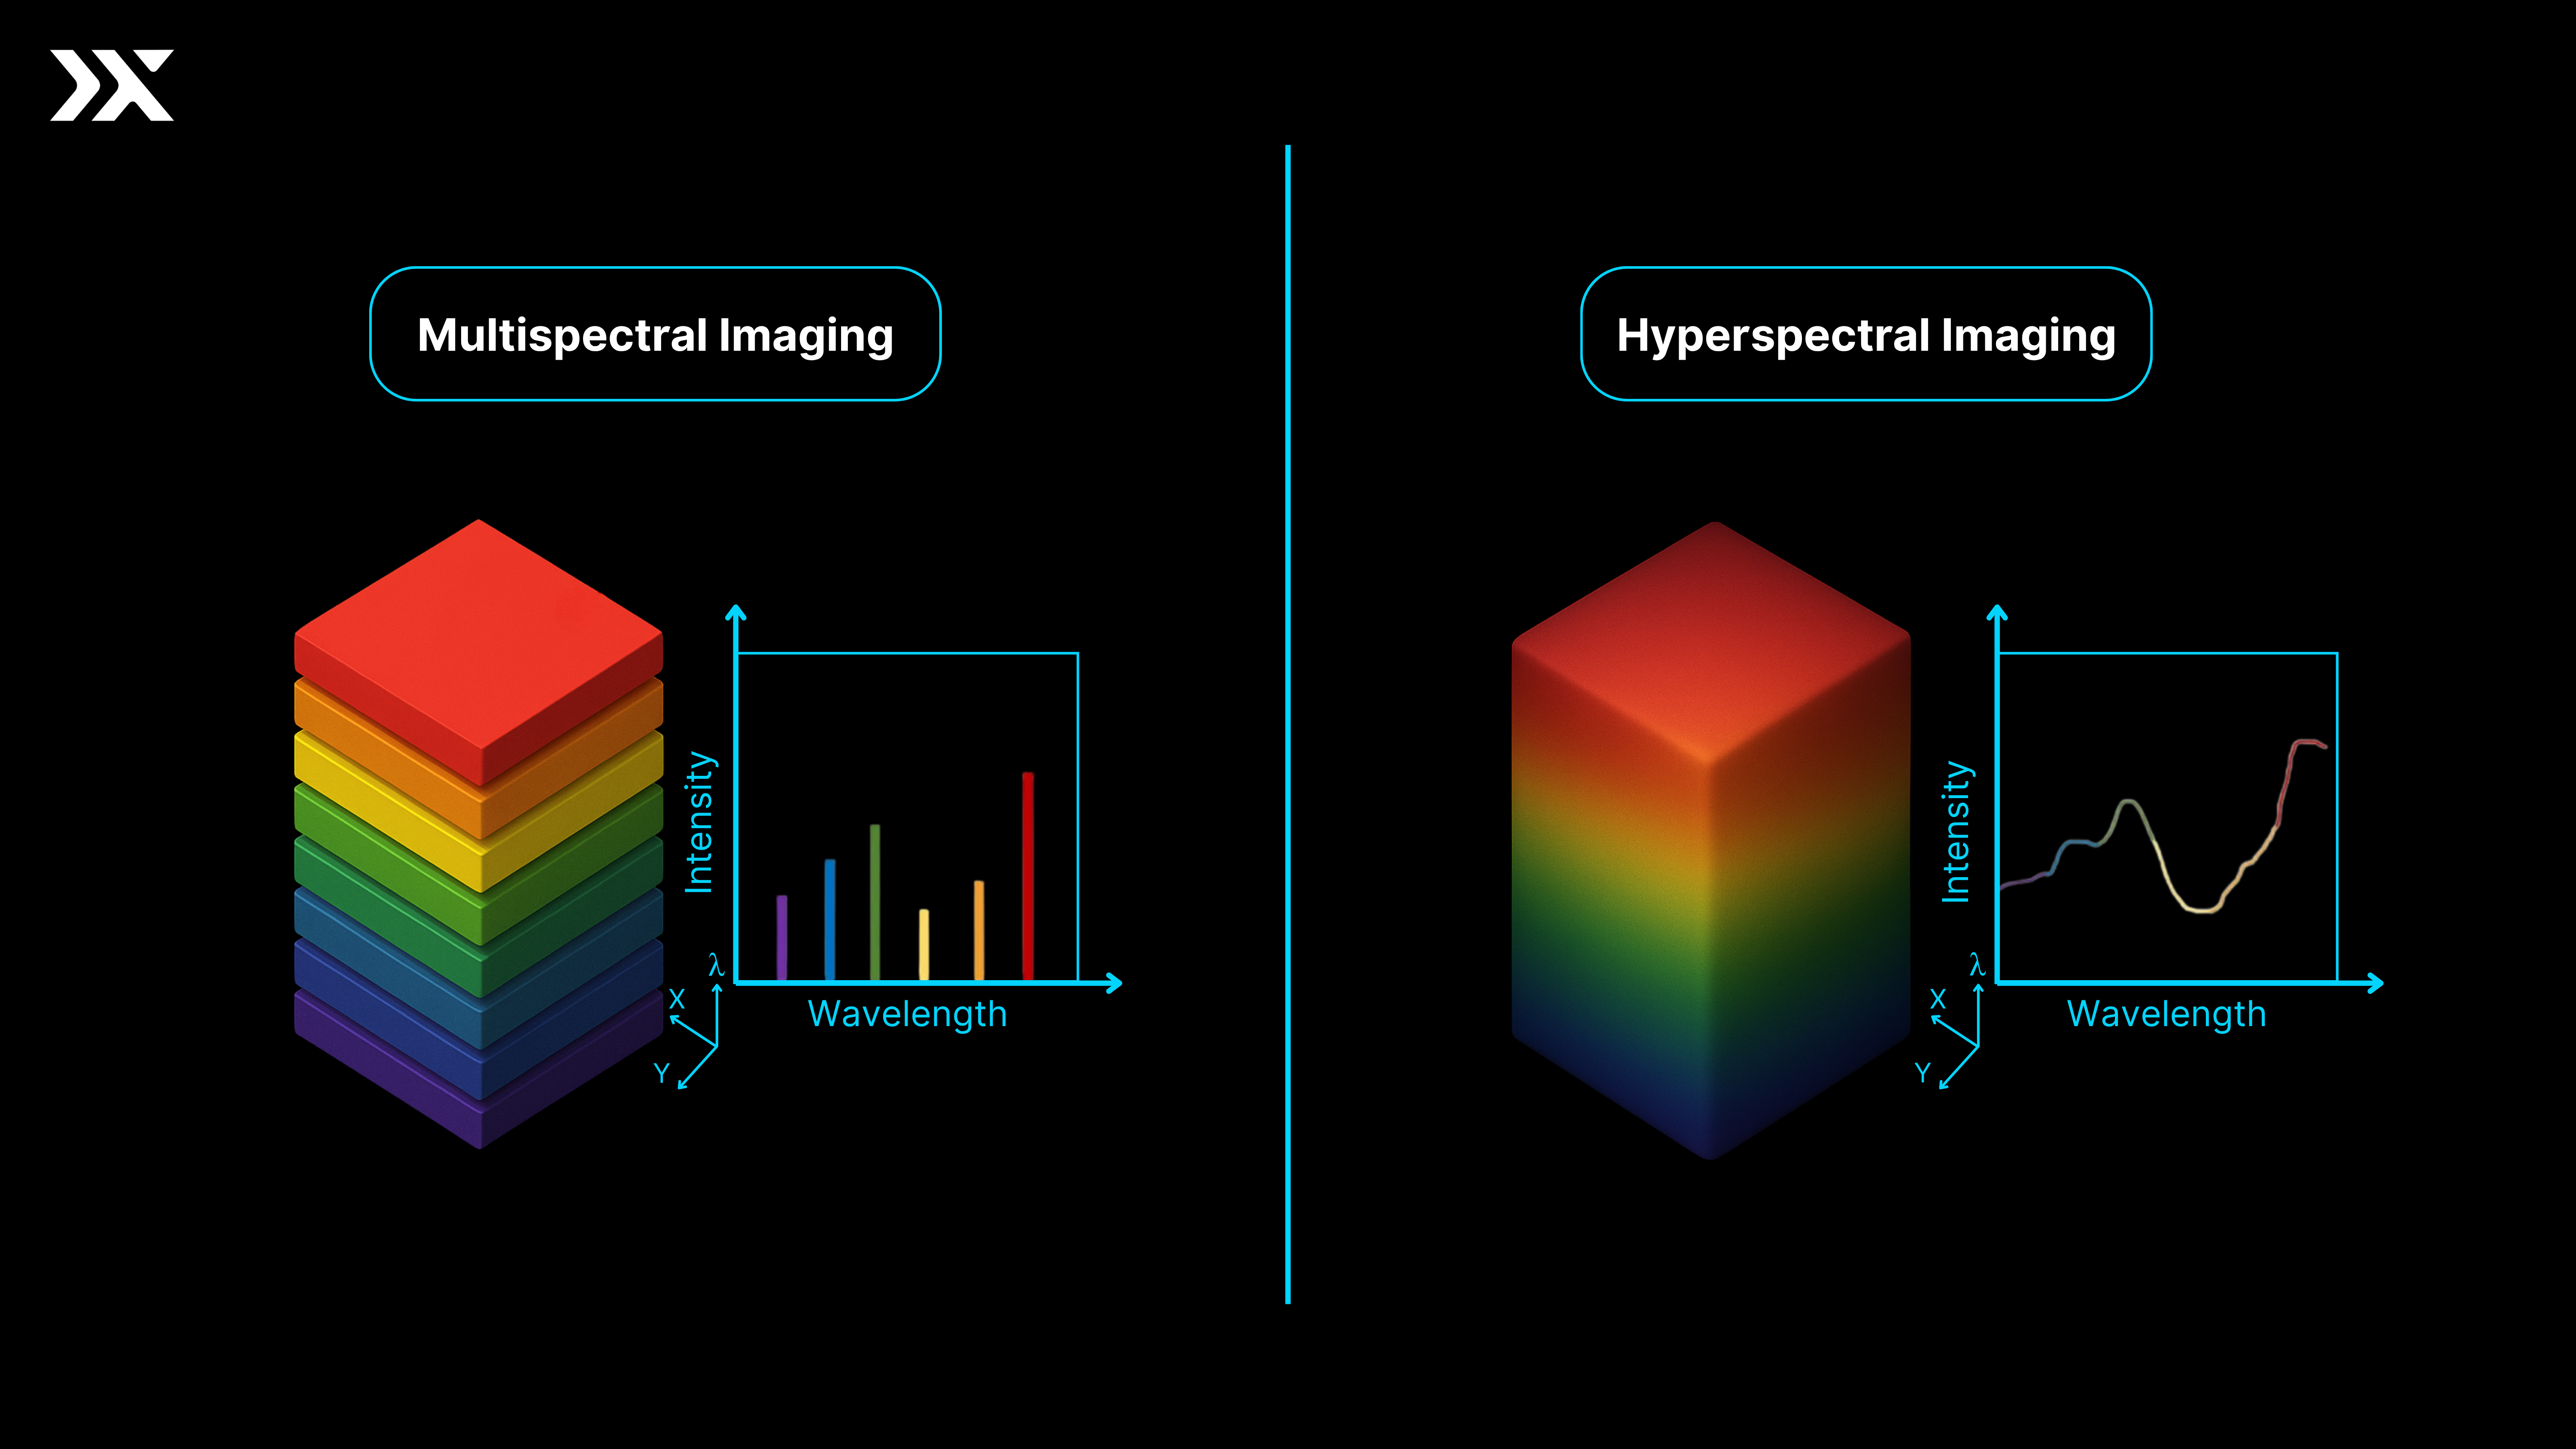
While multispectral systems might tell you “this is vegetation,” hyperspectral systems can say “this is nutrient-deficient maize under heat stress.”
Hyperspectral vs. Multispectral vs. RGB
To understand what sets HSI apart, it helps to compare it with more familiar remote sensing systems like multispectral and RGB imaging. Each type captures Earth’s surface in a different way. The difference comes down to how many spectral bands are collected, how narrow those bands are, and what level of detail they reveal about the materials within each pixel.
Remote sensing systems vary in the number of spectral bands they capture and the level of detail they reveal about Earth’s surface. RGB imaging is the most basic form, capturing three broad bands (Red, Green, and Blue) that align with human vision. Multispectral imaging (MSI) improves upon this by capturing reflectance in several discrete bands—typically 4 to 10—extending into the near-infrared (NIR) spectrum. HSI, however, significantly advances spectral analysis by capturing dozens to hundreds of contiguous narrow bands across the visible, NIR, and shortwave infrared (SWIR) regions, unlocking highly detailed spectral fingerprints for every pixel.
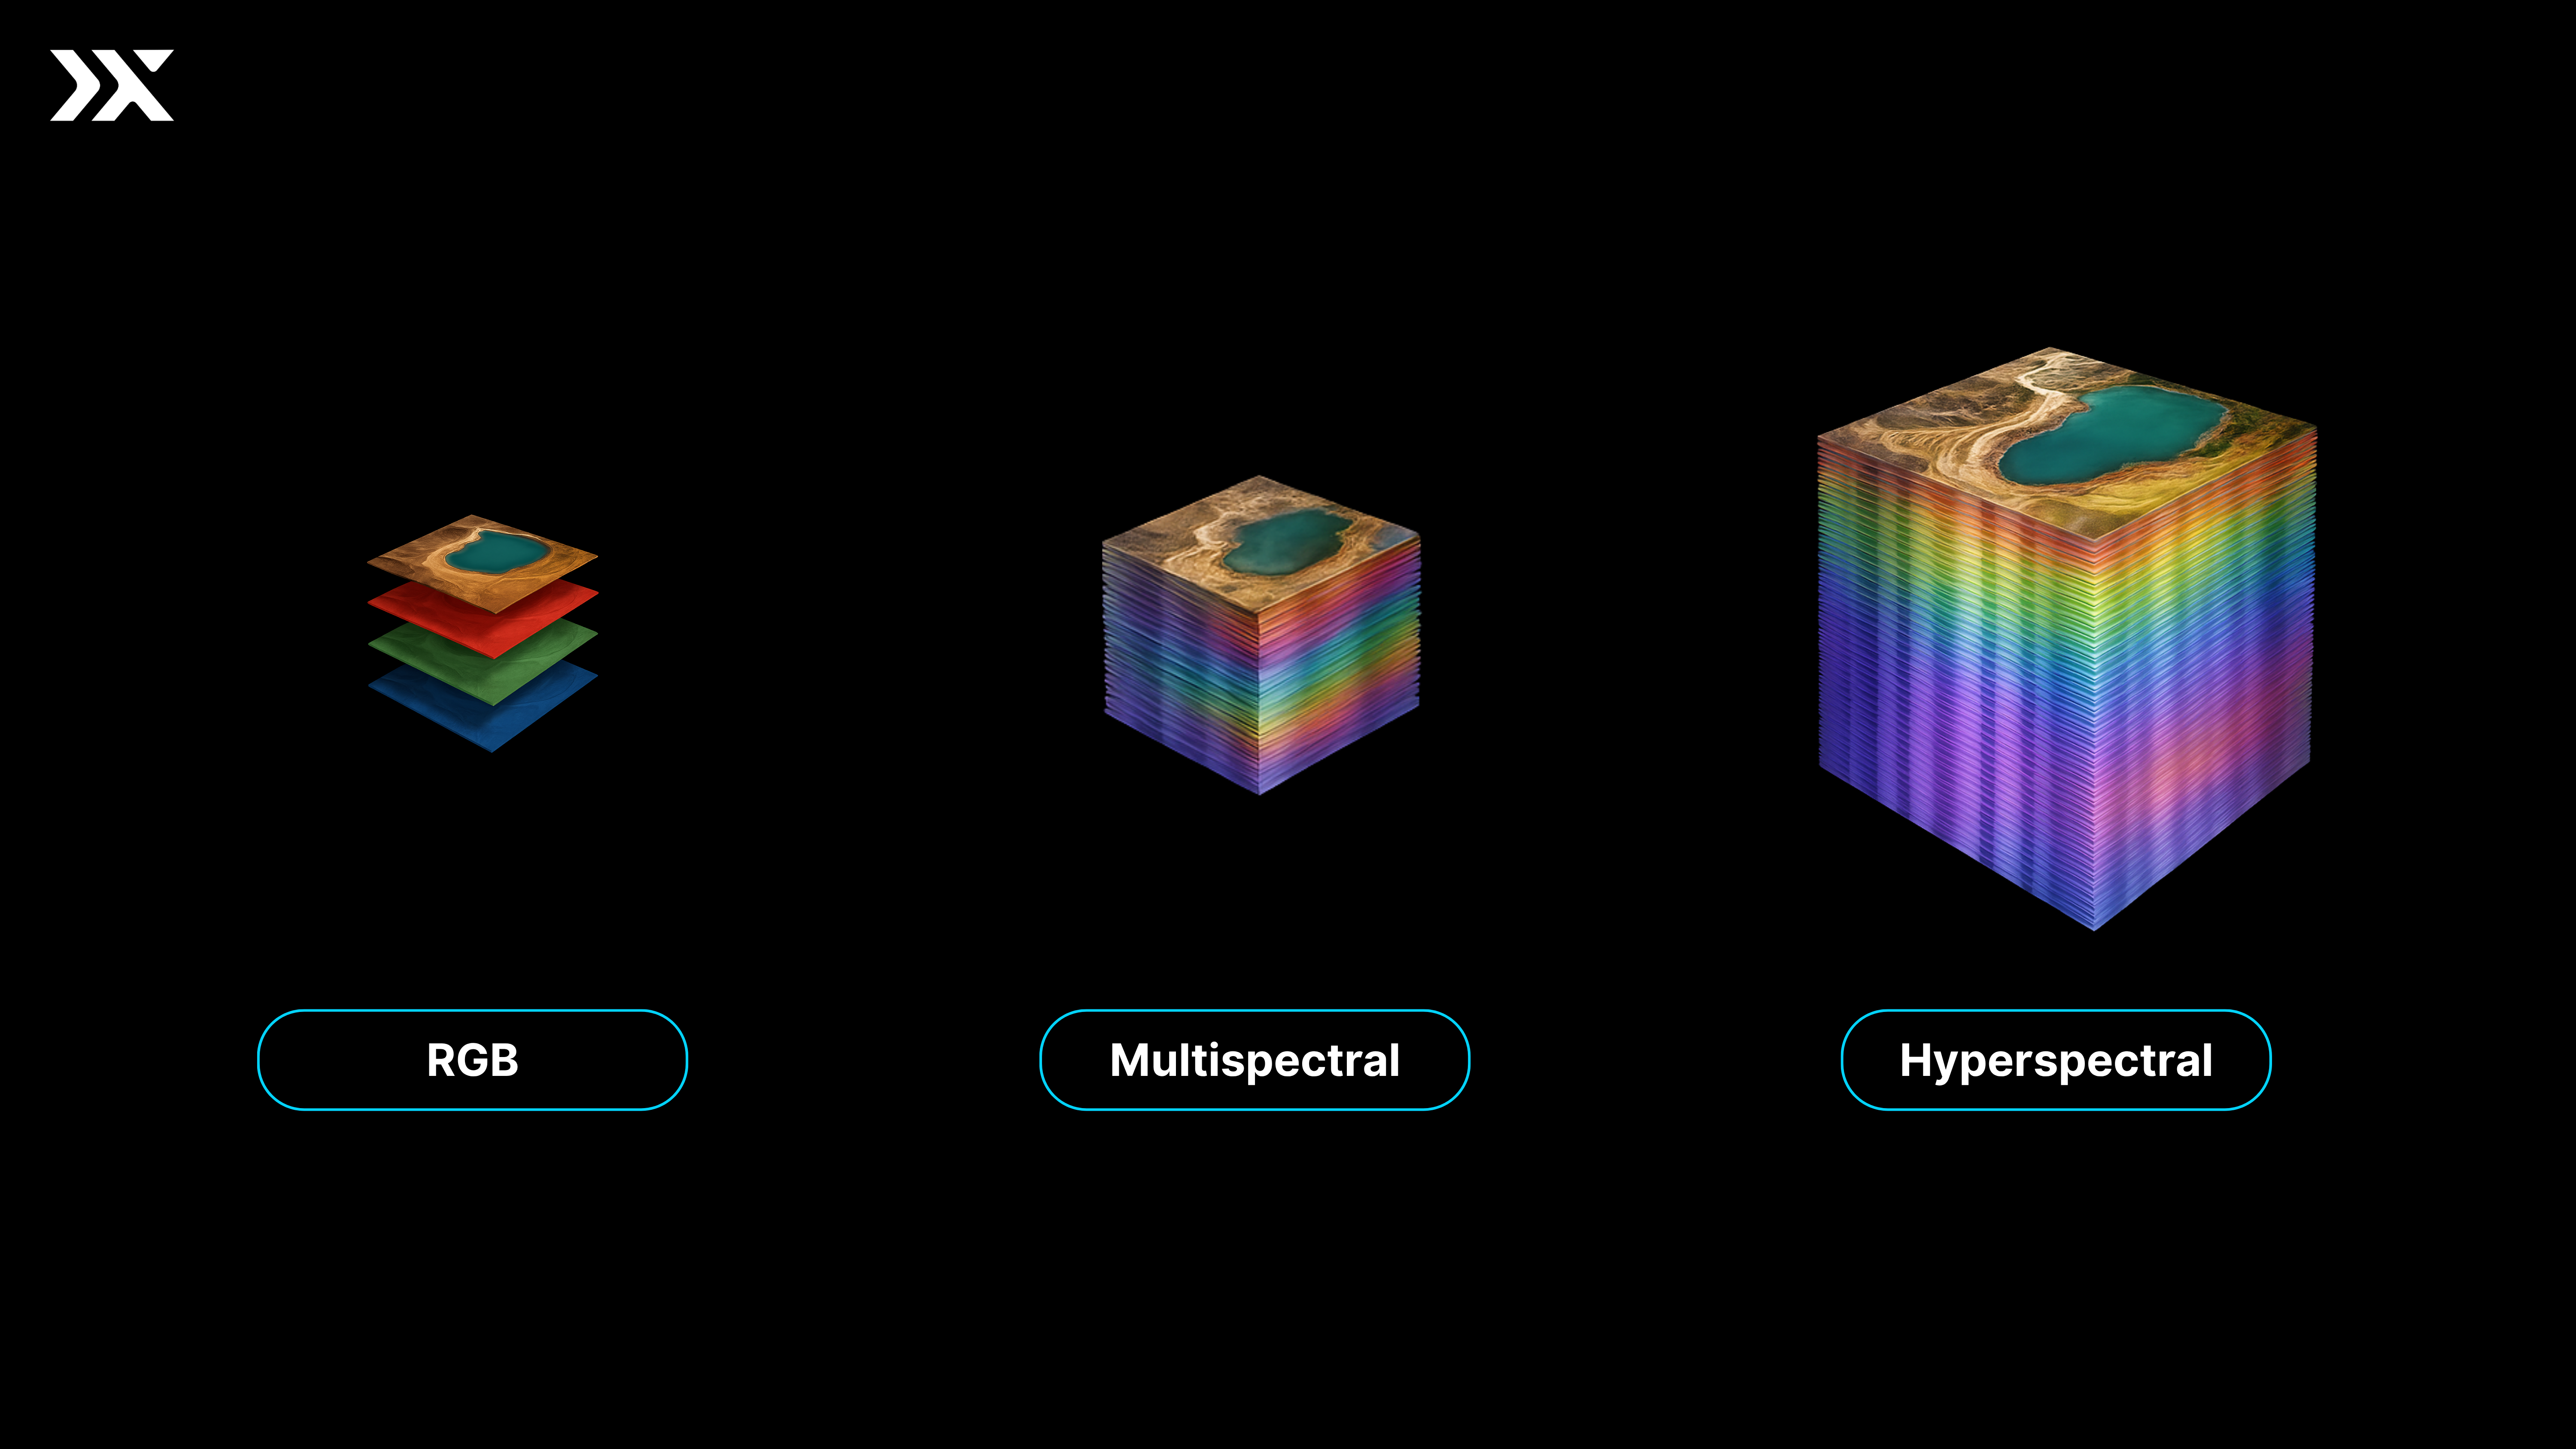
This progression—from RGB to MSI to HSI—represents a shift from visual inspection to precision material analysis, enabling applications ranging from environmental monitoring to mineral exploration and precision agriculture.
.png)