Can You Decode These
Environmental
Distress Signals?
Every surface on Earth reflects light in its own way. Healthy crops. Polluted water. A forest losing its canopy. To the naked eye and even a conventional satellite, these can look identical.
Hyperspectral sensors read light across hundreds of narrow bands of the electromagnetic spectrum, capturing chemical and biological signatures no other imaging technology can see. The images in this quiz were captured by Pixxel's Firefly satellites, the world's highest-resolution commercial hyperspectral constellation.
Five images. Five signals. Can you read what they're saying?
5 questions · 3 minutes
What do the yellow circles scattered across the field represent?

The yellow circles here represent different stages in the crop growth cycle, each with a unique spectral signature based on chlorophyll concentration, leaf structure, and water content, making them distinguishable from orbit even when they look identical to the naked eye.
Across agricultural applications, hyperspectral imaging can uncover crop variety, water stress, pest infestation, and nutrient levels across entire fields at once, revealing the full picture of agricultural health in a single pass.
Circular farms are created using center-pivot irrigation, enabling efficient crop growth even in arid desert environments.
What does the bright green colour in the water indicate?
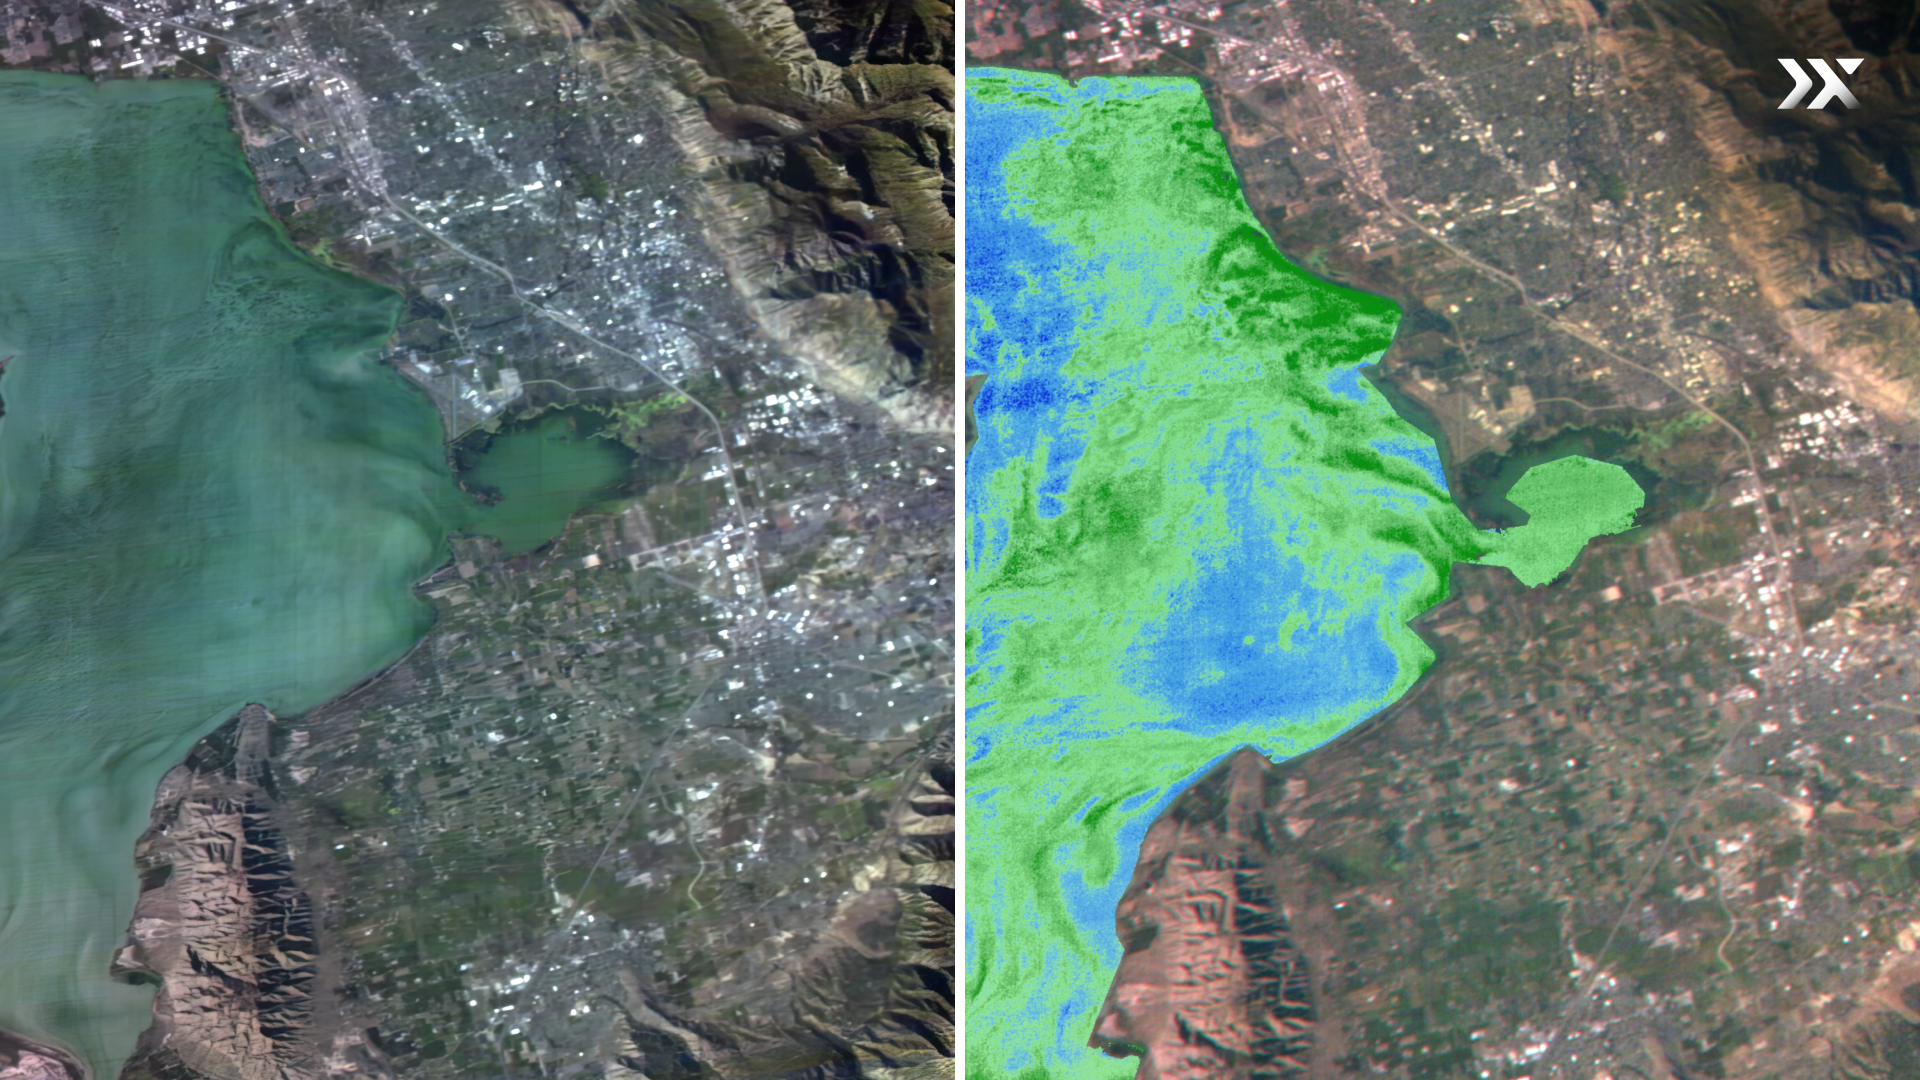
The bright green here marks algal bloom regions, driven by chlorophyll A, the pigment that surges when algal populations explode. Utah Lake is particularly prone to algal blooms, which remain invisible in conventional imagery until they're already severe.
In water monitoring, hyperspectral sensors can detect chlorophyll A concentrations across an entire water body at once, showing where blooms are forming, how dense they are, and how quickly they're spreading, vital information for protecting ecosystems and public health weeks before they become visible.
Utah Lake has been under algal bloom health advisories for most of the last decade, with full closures in several summers.
What does the red desert region reveal?

The desert floor holds more than it shows. The red here shows a mineral with a distinct spectral fingerprint, unmistakable to hyperspectral sensors but invisible to conventional satellites.
Different minerals absorb and reflect light in precise, identifiable ways. By reading those signatures, hyperspectral analysis can assess ground stability, identify resource-rich zones, and guide extraction. On a planet under mounting resource pressure, that precision in geology means we can target and measure what we take from the Earth, not guess at it.
Namibia is one of the world's largest uranium producers. Much of what the country holds underground has never been formally mapped.
What does the deep blue pooling across the water tell us?

The deep blue here reveals a concentration of chlorophyll A, a signal that algal activity is already underway before it would appear in any conventional image.
In freshwater monitoring, hyperspectral imaging allows scientists to track water quality across entire bodies, catching early signs of ecological stress before they compound, a critical window of warning on a planet where freshwater is increasingly finite.
The Dnipro river basin, visible here, supplies drinking water to roughly 30 million people.
What do the dark green patches across the slopes show?
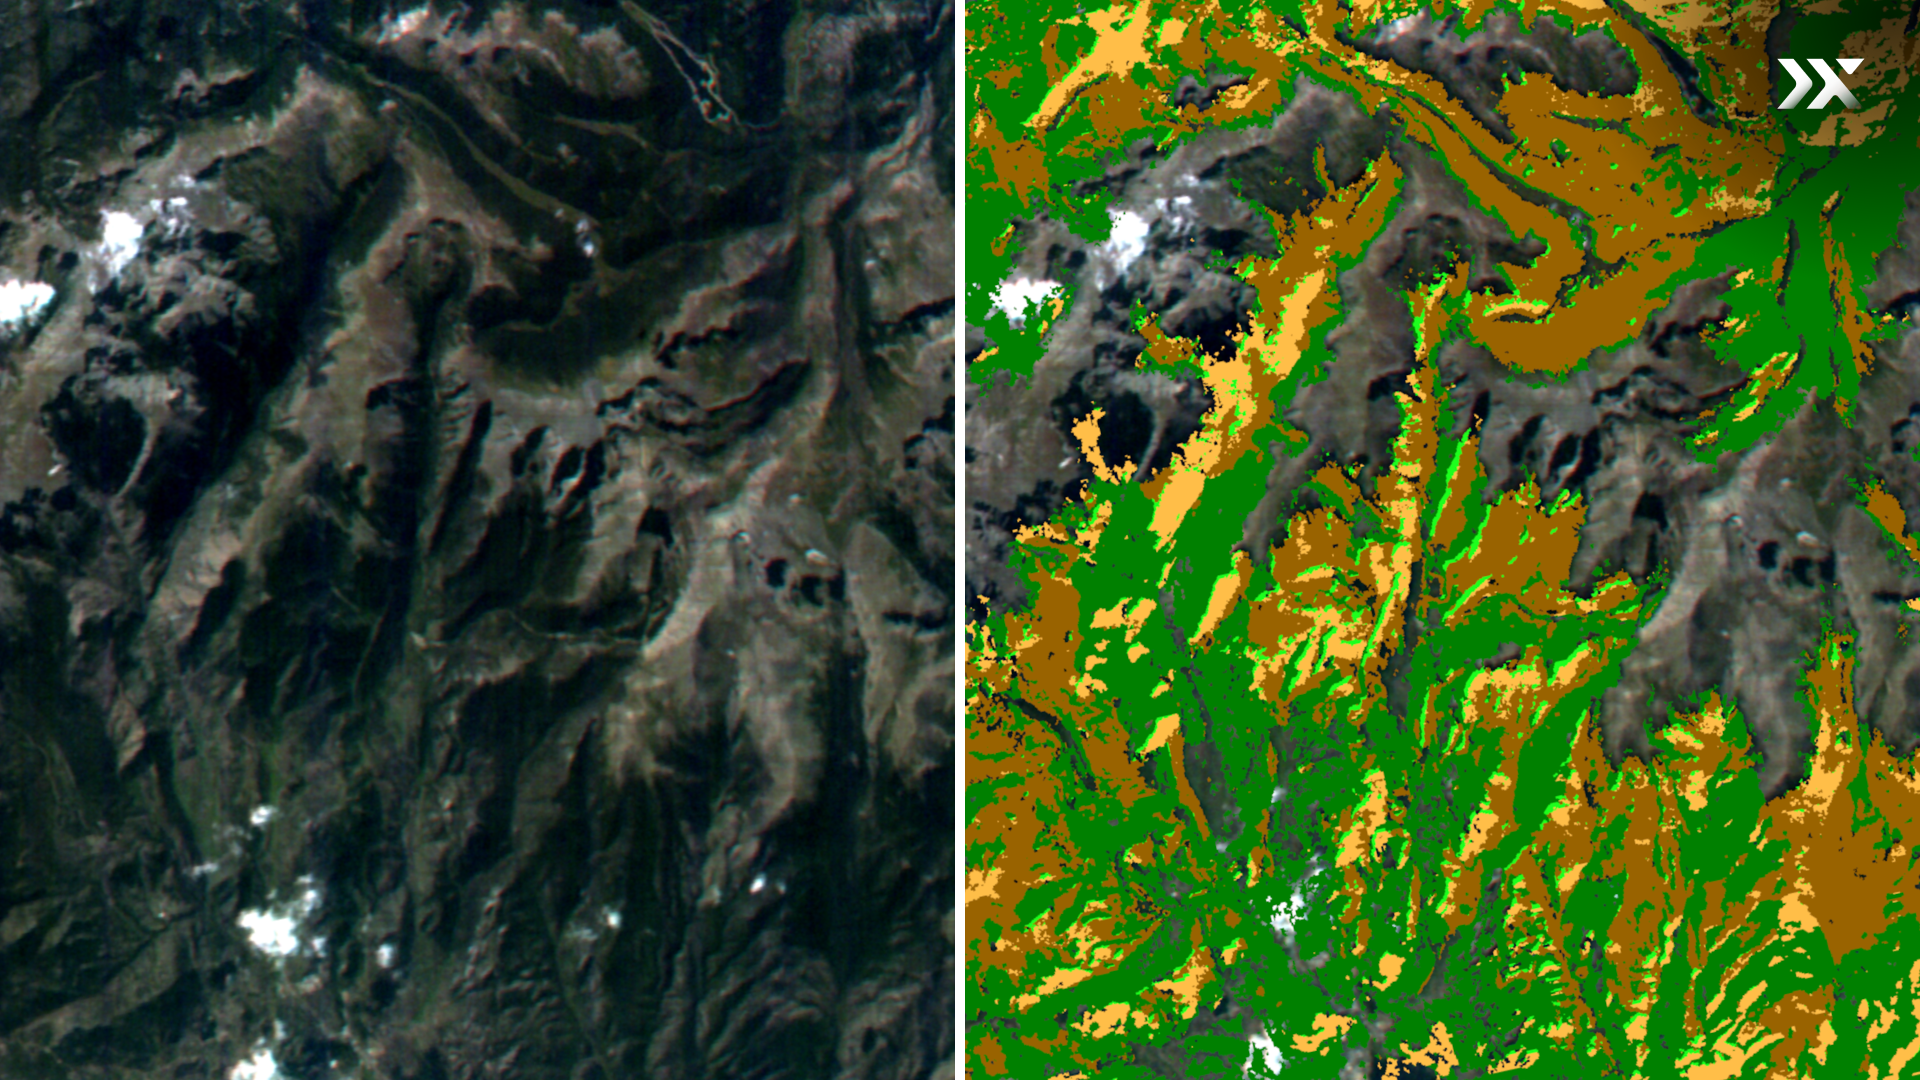
The dark green patches here identify a distinct canopy of Douglas Fir trees, distinguished by a spectral signature unique to their needle structure, canopy density, and chlorophyll composition, invisible to the naked eye alone.
Hyperspectral imaging can aid biodiversity monitoring by classifying tree species from orbit, tracking the spread of invasive species, and assessing ecosystem health across landscapes too vast or precarious to survey on foot, giving scientists the clarity to act before it's too late.
The Rocky Mountains extend more than 4,800 kilometres from north to south. Ground surveys can cover a fraction of that.